

Asleep at the wheel, or, How I learned to stop worrying and love the bomb
April 09, 2008
By James Montier
About a month ago I wrote a note suggesting that analysts were like rabbits caught in the headlights (see Mind Matters, 21 January 2008). It now appears that the analysts may well have fallen asleep at the wheel!
The chart below is an updated version of the one I presented in the original note. It is constructed by taking a linear time trend out of operating earnings and the analyst forecasts of those earnings (so the chart simply plots deviations from trend in $ per share terms).
The chart makes is transparently obvious that analysts lag reality. They only change their minds when there is irrefutable proof they were wrong, and then only change their minds very slowly.

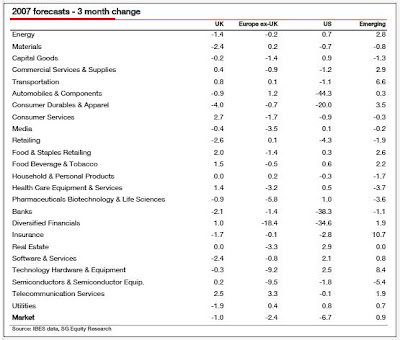
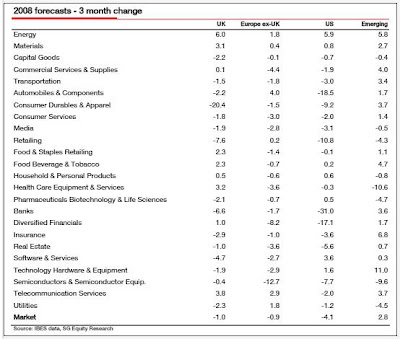
The beginning of the downturn in earnings is clearly visible from this chart. However, analysts have hardly scratched their earnings numbers at all. This view is reaffirmed by the numbers from my colleague in quant land, Andrew Lapthorne, shown in the tables below. So far the downgrading of estimates has been highly constrained to the financials (and to a lesser extent the consumer sector in the US for 2007). Roughly speaking US earnings ex financials have been revised down by 1.5% compared to nearer 4% for the market as a whole.
I've had several conversations of late with both buy and sell side firms who have been busy trying to get their analysts to bring down their estimates. The response from the analysts has been exceedingly similar across the various institutions. The analysts all acknowledge the sense of lowering forecasts in aggregate. However, when they discuss such a move with the companies they cover, the companies. response is that it won't happen to them. This creates a fallacy of composition problem in which all the analysts think 'their' stocks are immune from the influence of the cycle!
Memo to analysts: companies haven't got a clue
One our analysts (thanks Stefan) has provided me with several examples of the sort of lines that company management are spinning. For instance, the following comes from Sopra group (a specialist in "industry specific solutions (Banking, Human Resources and Real Estate"), "We have made the right choices in terms of positioning and we have implemented a successful business model fuelled not only by technological development but also by both the trend towards outsourcing and enterprise consolidation. We don't believe that our business model is subject to a cyclical downturn that is often talked about these days."
Or this from Parametric Techology Corp, "We are mindful of current investor concerns about the economy. However, our forecast continues to support our confidence in our ability to execute our plan... These customer initiatives have been driving investment in our solutions for at least two years, and we believe customers would only accelerate them in a more difficult economic environment." I love this latter one, effectively saying a recession is just what our business needs, we will make even more money in a downturn!
Now of course, I am a well known critic of talking to company management (see Chapter 12 in Behavioural Investing for the detail on this). In general the evidence suggests that company management doesn't know any better than we do, especially when it comes to predicting the future.
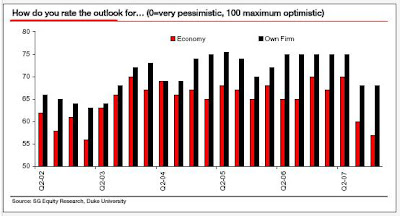
For example, the chart below shows the results from the Duke University CFO survey. In the survey, participants are asked to rate their optimism over the outlook for both the economy and their own firms. Strangely enough they are always and everywhere more optimistic about the outlook for their own firm than they are about the economy as a whole. This is yet more evidence of the bullish bias that I was describing in the last Mind Matters. The latest survey carried out in December 2007 shows CFOs are around 57% optimistic about the economy (a relatively low reading) but are 68% optimistic about the outlook for their own firms!
I must also confess that I am disappointed (although not surprised) that analysts on average appear to be incapable of forming a view without the endorsement of company management. One must wonder why we pay legions of analysts if they are simply drip fed the management views like quasi IRs!
One of the few surveys I keep an eye on is the Conference Board CEO survey. This survey has reasonable predictive power when it comes to earnings growth. It tells a very different story from the ones discussed above. These guys are most definitely not optimistic about the outlook. They are expecting growth to keep sliding away, and that isn't good news for profits!

What is in the price?
Of course, pretty much every investor I have talked to this year has told me that "No one believes the analysts." In part this may be true. However, it is clearly the case that when a stock disappoints it still gets punished severely. So whilst top-down investors may not accept the analysts. numbers, I can't help but wonder if some of the more bottom-up inclined are still shocked when something goes awry.
Others have told me that I'm worrying needlessly, as equities have already moved to discount a slowdown, so whilst the analysts may be behind the curve, markets aren't. Whilst this may be comforting, is it actually true?
I decided to check what the markets were implying for earnings contractions. Being a simple soul, I came up with easy way of doing exactly this. Now I don't hold with the use of forward P/Es as I think they are largely meaningless. However, for this exercise I put aside my personal biases against this measure. I just take the current forward P/E and compare it with the historic average of the forward P/E. The extent to which the current forward P/E is below its average is presumably a measure of the expected earnings decline. As the table below shows, on this basis the US is pricing in an 8% decline in earnings, Europe a 24% decline and the UK a 23% decline.
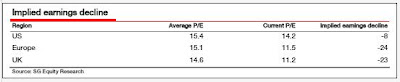
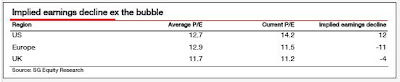
However, to my mind there is a problem with this process, and that is the historic forward P/E series is distorted by the experience of the bubble in the latter half of the 1990s. This was, of course, an incredibly unusual period, so one could argue that it should be excluded from the calculation of the average forward P/E. The table below shows the impact of excluding the bubble from our calculations. Now the US doesn't imply any drop in earnings, Europe implies an 11% fall in earnings, and the UK implies a 4% decline in earnings.
Now how does this implied decline in earnings stack up against the empirical evidence on the scale of earnings declines in recessions? Well, the history of 'operating earnings' only goes back as far as the analysts. forecasts (i.e. the early to mid 1980s). This only gives two recessions to examine, and both of those have been exceptionally shallow. However, even in these shallow recessions earnings fell by 20% in the US, and 40% in Europe.
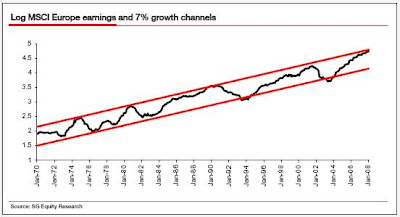
If we want to broaden our sample (always a good idea) we have to turn to reported earnings (generally my preferred measure). The chart below shows the European version of a chart I have often shown for the US. It simply plots earnings (in log terms), and shows that over the course of a full cycle they have never grown by more than 7% p.a. Recently we have been at the very top edge of this band. However, more importantly once earnings have peaked they often return to the low edge of the growth bands. This represents a 45%- 50% decline in earnings. This number holds for the US, Europe and the UK. So if you want to have a worse case scenario then a figure like this should be used.
Relative to this benchmark, the implied earnings declines are paltry. So the idea that the equity markets are anticipating a recession unfortunately looks to be yet another example of the triumph of hope over reality. I guess I really haven't learnt to stop worrying and love the bomb just yet!
Published on Tue, Apr 8 2008, 06:00 GMT
About a month ago I wrote a note suggesting that analysts were like rabbits caught in the headlights (see Mind Matters, 21 January 2008). It now appears that the analysts may well have fallen asleep at the wheel!
The chart below is an updated version of the one I presented in the original note. It is constructed by taking a linear time trend out of operating earnings and the analyst forecasts of those earnings (so the chart simply plots deviations from trend in $ per share terms).
The chart makes is transparently obvious that analysts lag reality. They only change their minds when there is irrefutable proof they were wrong, and then only change their minds very slowly.

The beginning of the downturn in earnings is clearly visible from this chart. However, analysts have hardly scratched their earnings numbers at all. This view is reaffirmed by the numbers from my colleague in quant land, Andrew Lapthorne, shown in the tables below. So far the downgrading of estimates has been highly constrained to the financials (and to a lesser extent the consumer sector in the US for 2007). Roughly speaking US earnings ex financials have been revised down by 1.5% compared to nearer 4% for the market as a whole.


I've had several conversations of late with both buy and sell side firms who have been busy trying to get their analysts to bring down their estimates. The response from the analysts has been exceedingly similar across the various institutions. The analysts all acknowledge the sense of lowering forecasts in aggregate. However, when they discuss such a move with the companies they cover, the companies. response is that it won't happen to them. This creates a fallacy of composition problem in which all the analysts think 'their' stocks are immune from the influence of the cycle!
Memo to analysts: companies haven't got a clue
One our analysts (thanks Stefan) has provided me with several examples of the sort of lines that company management are spinning. For instance, the following comes from Sopra group (a specialist in "industry specific solutions (Banking, Human Resources and Real Estate"), "We have made the right choices in terms of positioning and we have implemented a successful business model fuelled not only by technological development but also by both the trend towards outsourcing and enterprise consolidation. We don't believe that our business model is subject to a cyclical downturn that is often talked about these days."
Or this from Parametric Techology Corp, "We are mindful of current investor concerns about the economy. However, our forecast continues to support our confidence in our ability to execute our plan... These customer initiatives have been driving investment in our solutions for at least two years, and we believe customers would only accelerate them in a more difficult economic environment." I love this latter one, effectively saying a recession is just what our business needs, we will make even more money in a downturn!
Now of course, I am a well known critic of talking to company management (see Chapter 12 in Behavioural Investing for the detail on this). In general the evidence suggests that company management doesn't know any better than we do, especially when it comes to predicting the future.
For example, the chart below shows the results from the Duke University CFO survey. In the survey, participants are asked to rate their optimism over the outlook for both the economy and their own firms. Strangely enough they are always and everywhere more optimistic about the outlook for their own firm than they are about the economy as a whole. This is yet more evidence of the bullish bias that I was describing in the last Mind Matters. The latest survey carried out in December 2007 shows CFOs are around 57% optimistic about the economy (a relatively low reading) but are 68% optimistic about the outlook for their own firms!

I must also confess that I am disappointed (although not surprised) that analysts on average appear to be incapable of forming a view without the endorsement of company management. One must wonder why we pay legions of analysts if they are simply drip fed the management views like quasi IRs!
One of the few surveys I keep an eye on is the Conference Board CEO survey. This survey has reasonable predictive power when it comes to earnings growth. It tells a very different story from the ones discussed above. These guys are most definitely not optimistic about the outlook. They are expecting growth to keep sliding away, and that isn't good news for profits!

What is in the price?
Of course, pretty much every investor I have talked to this year has told me that "No one believes the analysts." In part this may be true. However, it is clearly the case that when a stock disappoints it still gets punished severely. So whilst top-down investors may not accept the analysts. numbers, I can't help but wonder if some of the more bottom-up inclined are still shocked when something goes awry.
Others have told me that I'm worrying needlessly, as equities have already moved to discount a slowdown, so whilst the analysts may be behind the curve, markets aren't. Whilst this may be comforting, is it actually true?
I decided to check what the markets were implying for earnings contractions. Being a simple soul, I came up with easy way of doing exactly this. Now I don't hold with the use of forward P/Es as I think they are largely meaningless. However, for this exercise I put aside my personal biases against this measure. I just take the current forward P/E and compare it with the historic average of the forward P/E. The extent to which the current forward P/E is below its average is presumably a measure of the expected earnings decline. As the table below shows, on this basis the US is pricing in an 8% decline in earnings, Europe a 24% decline and the UK a 23% decline.

However, to my mind there is a problem with this process, and that is the historic forward P/E series is distorted by the experience of the bubble in the latter half of the 1990s. This was, of course, an incredibly unusual period, so one could argue that it should be excluded from the calculation of the average forward P/E. The table below shows the impact of excluding the bubble from our calculations. Now the US doesn't imply any drop in earnings, Europe implies an 11% fall in earnings, and the UK implies a 4% decline in earnings.

Now how does this implied decline in earnings stack up against the empirical evidence on the scale of earnings declines in recessions? Well, the history of 'operating earnings' only goes back as far as the analysts. forecasts (i.e. the early to mid 1980s). This only gives two recessions to examine, and both of those have been exceptionally shallow. However, even in these shallow recessions earnings fell by 20% in the US, and 40% in Europe.
If we want to broaden our sample (always a good idea) we have to turn to reported earnings (generally my preferred measure). The chart below shows the European version of a chart I have often shown for the US. It simply plots earnings (in log terms), and shows that over the course of a full cycle they have never grown by more than 7% p.a. Recently we have been at the very top edge of this band. However, more importantly once earnings have peaked they often return to the low edge of the growth bands. This represents a 45%- 50% decline in earnings. This number holds for the US, Europe and the UK. So if you want to have a worse case scenario then a figure like this should be used.

Relative to this benchmark, the implied earnings declines are paltry. So the idea that the equity markets are anticipating a recession unfortunately looks to be yet another example of the triumph of hope over reality. I guess I really haven't learnt to stop worrying and love the bomb just yet!
Published on Tue, Apr 8 2008, 06:00 GMT

